

Industrial materials and tools company Kennametal (NYSE:KMT) fell short of the market’s revenue expectations in Q2 CY2025, with sales falling 4.9% year on year to $516.4 million. Next quarter’s revenue guidance of $475 million underwhelmed, coming in 2.9% below analysts’ estimates. Its non-GAAP profit of $0.34 per share was 13.1% below analysts’ consensus estimates.
Is now the time to buy Kennametal? Find out by accessing our full research report, it’s free.
Kennametal (KMT) Q2 CY2025 Highlights:
- Revenue: $516.4 million vs analyst estimates of $526.4 million (4.9% year-on-year decline, 1.9% miss)
- Adjusted EPS: $0.34 vs analyst expectations of $0.39 (13.1% miss)
- Revenue Guidance for Q3 CY2025 is $475 million at the midpoint, below analyst estimates of $489 million
- Adjusted EPS guidance for the upcoming financial year 2026 is $1.10 at the midpoint, missing analyst estimates by 23.4%
- Operating Margin: 6.1%, down from 11.3% in the same quarter last year
- Free Cash Flow Margin: 11.1%, down from 16.7% in the same quarter last year
- Organic Revenue fell 5% year on year (-0.8% in the same quarter last year)
- Market Capitalization: $1.92 billion
Company Overview
Involved in manufacturing hard tips of anti-tank projectiles in World War II, Kennametal (NYSE:KMT) is a provider of industrial materials and tools for various sectors.
Revenue Growth
Reviewing a company’s long-term sales performance reveals insights into its quality. Any business can put up a good quarter or two, but many enduring ones grow for years. Unfortunately, Kennametal struggled to consistently increase demand as its $1.97 billion of sales for the trailing 12 months was close to its revenue five years ago. This wasn’t a great result and is a sign of poor business quality.
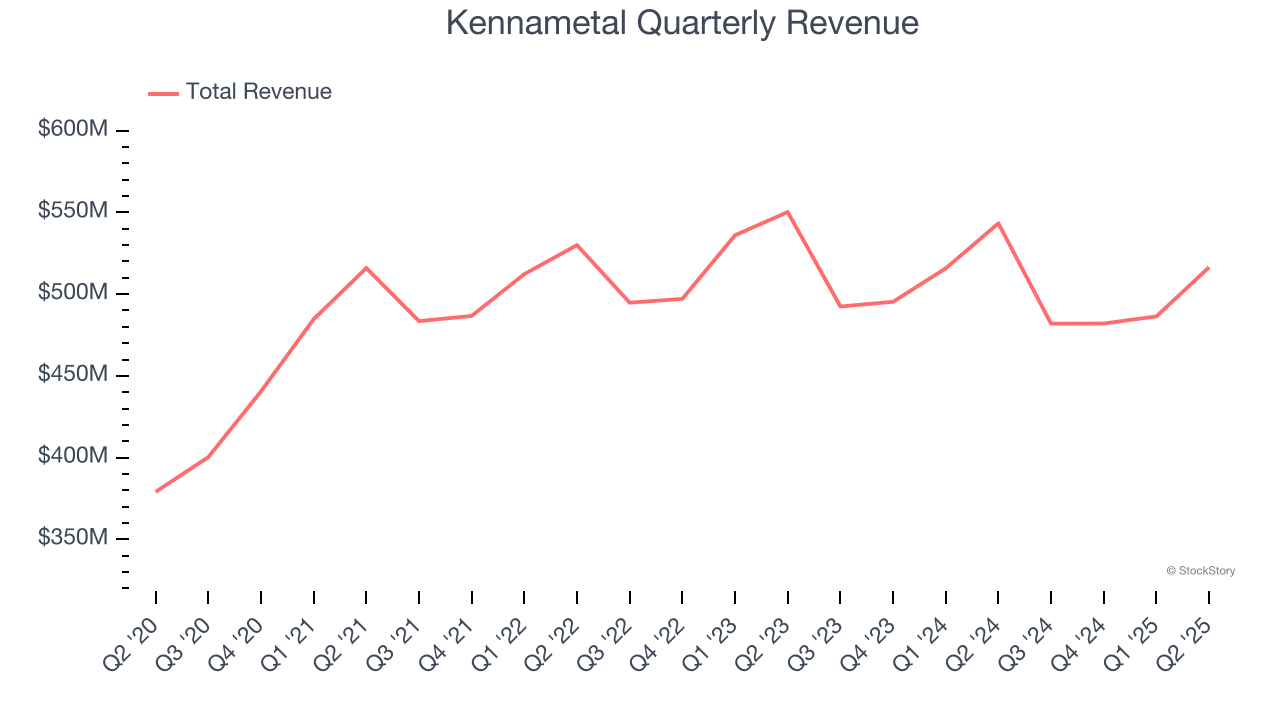
We at StockStory place the most emphasis on long-term growth, but within industrials, a half-decade historical view may miss cycles, industry trends, or a company capitalizing on catalysts such as a new contract win or a successful product line. Kennametal’s recent performance shows its demand remained suppressed as its revenue has declined by 2.7% annually over the last two years. 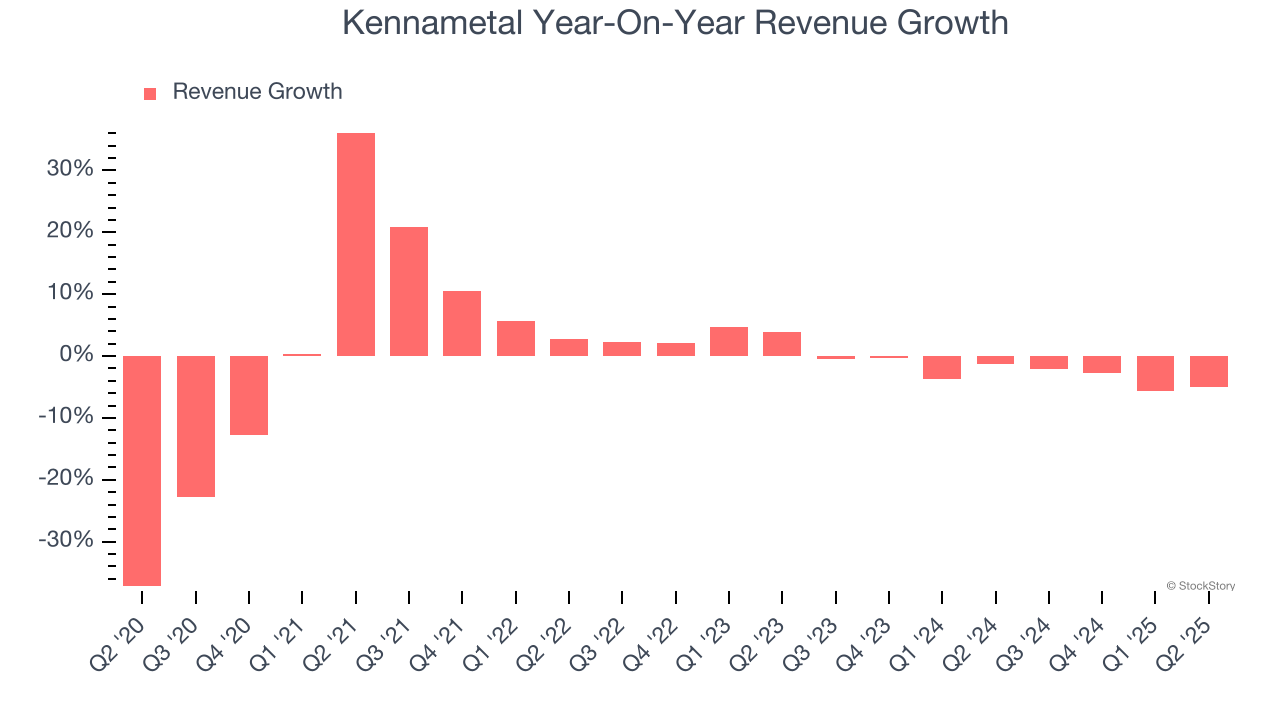
We can better understand the company’s sales dynamics by analyzing its organic revenue, which strips out one-time events like acquisitions and currency fluctuations that don’t accurately reflect its fundamentals. Over the last two years, Kennametal’s organic revenue averaged 2.8% year-on-year declines. Because this number aligns with its two-year revenue growth, we can see the company’s core operations (not acquisitions and divestitures) drove most of its results. 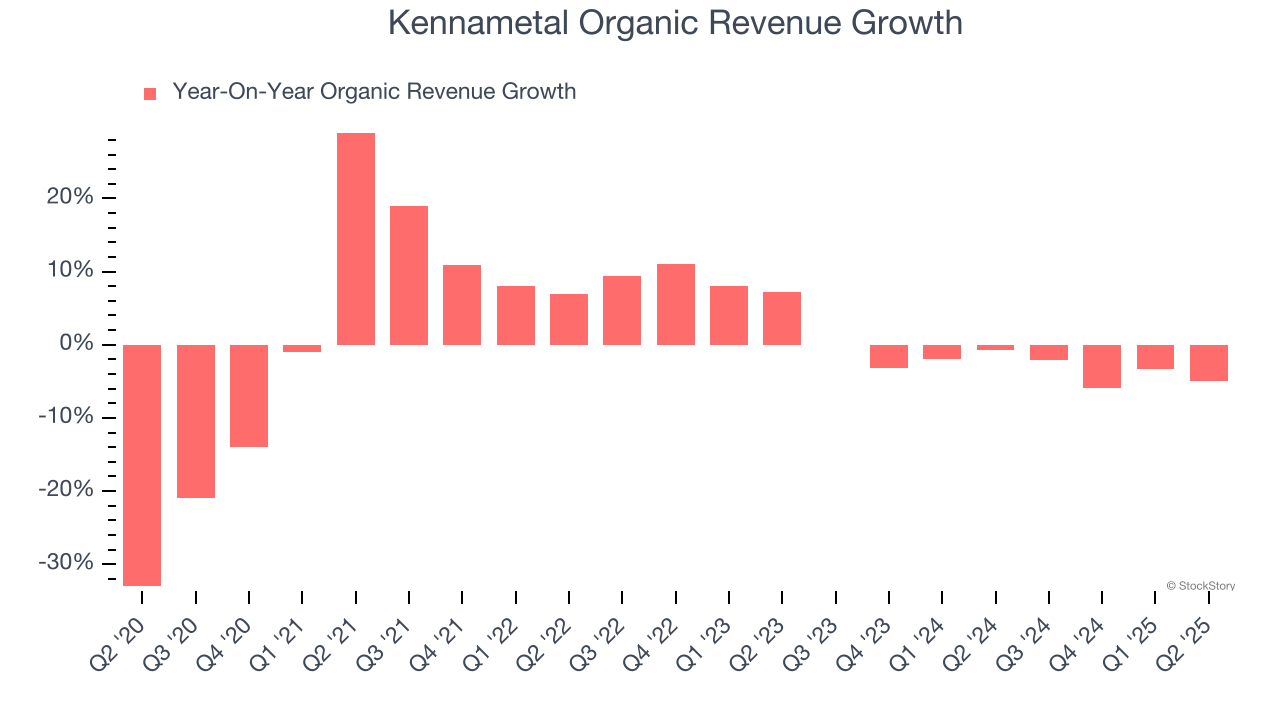
This quarter, Kennametal missed Wall Street’s estimates and reported a rather uninspiring 4.9% year-on-year revenue decline, generating $516.4 million of revenue. Company management is currently guiding for a 1.4% year-on-year decline in sales next quarter.
Looking further ahead, sell-side analysts expect revenue to grow 3.4% over the next 12 months. While this projection indicates its newer products and services will spur better top-line performance, it is still below the sector average.
Here at StockStory, we certainly understand the potential of thematic investing. Diverse winners from Microsoft (MSFT) to Alphabet (GOOG), Coca-Cola (KO) to Monster Beverage (MNST) could all have been identified as promising growth stories with a megatrend driving the growth. So, in that spirit, we’ve identified a relatively under-the-radar profitable growth stock benefiting from the rise of AI, available to you FREE via this link.
Operating Margin
Kennametal has done a decent job managing its cost base over the last five years. The company has produced an average operating margin of 8.3%, higher than the broader industrials sector.
Looking at the trend in its profitability, Kennametal’s operating margin rose by 1.7 percentage points over the last five years, showing its efficiency has improved.
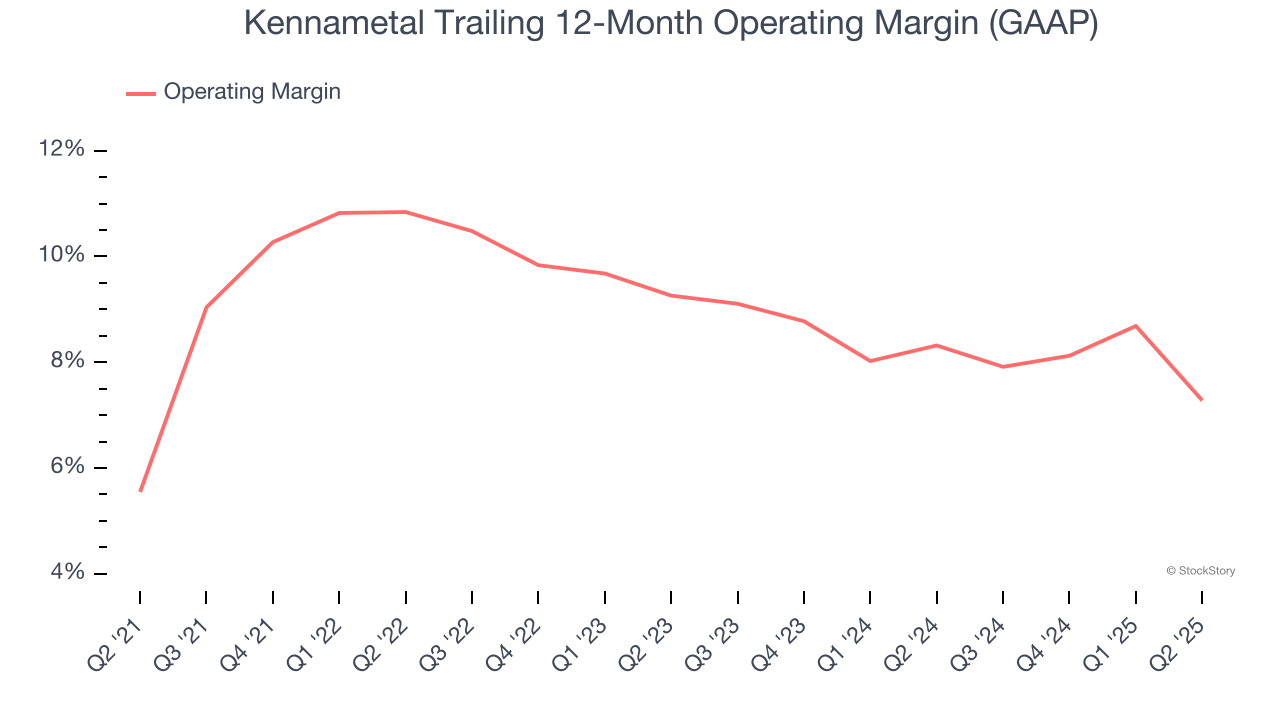
In Q2, Kennametal generated an operating margin profit margin of 6.1%, down 5.2 percentage points year on year. Since Kennametal’s operating margin decreased more than its gross margin, we can assume it was less efficient because expenses such as marketing, R&D, and administrative overhead increased.
Earnings Per Share
We track the long-term change in earnings per share (EPS) for the same reason as long-term revenue growth. Compared to revenue, however, EPS highlights whether a company’s growth is profitable.
Kennametal’s EPS grew at an unimpressive 7.3% compounded annual growth rate over the last five years. On the bright side, this performance was better than its flat revenue and tells us management responded to softer demand by adapting its cost structure.
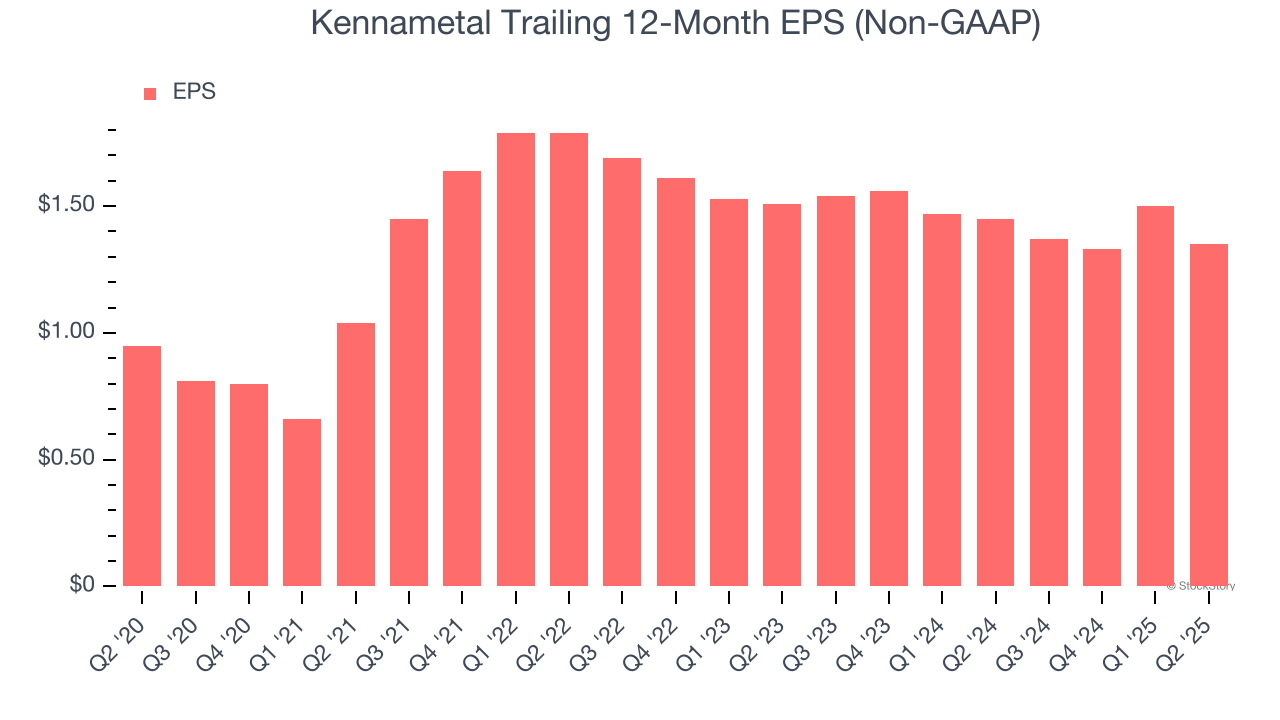
We can take a deeper look into Kennametal’s earnings to better understand the drivers of its performance. As we mentioned earlier, Kennametal’s operating margin declined this quarter but expanded by 1.7 percentage points over the last five years. Its share count also shrank by 7.4%, and these factors together are positive signs for shareholders because improving profitability and share buybacks turbocharge EPS growth relative to revenue growth. 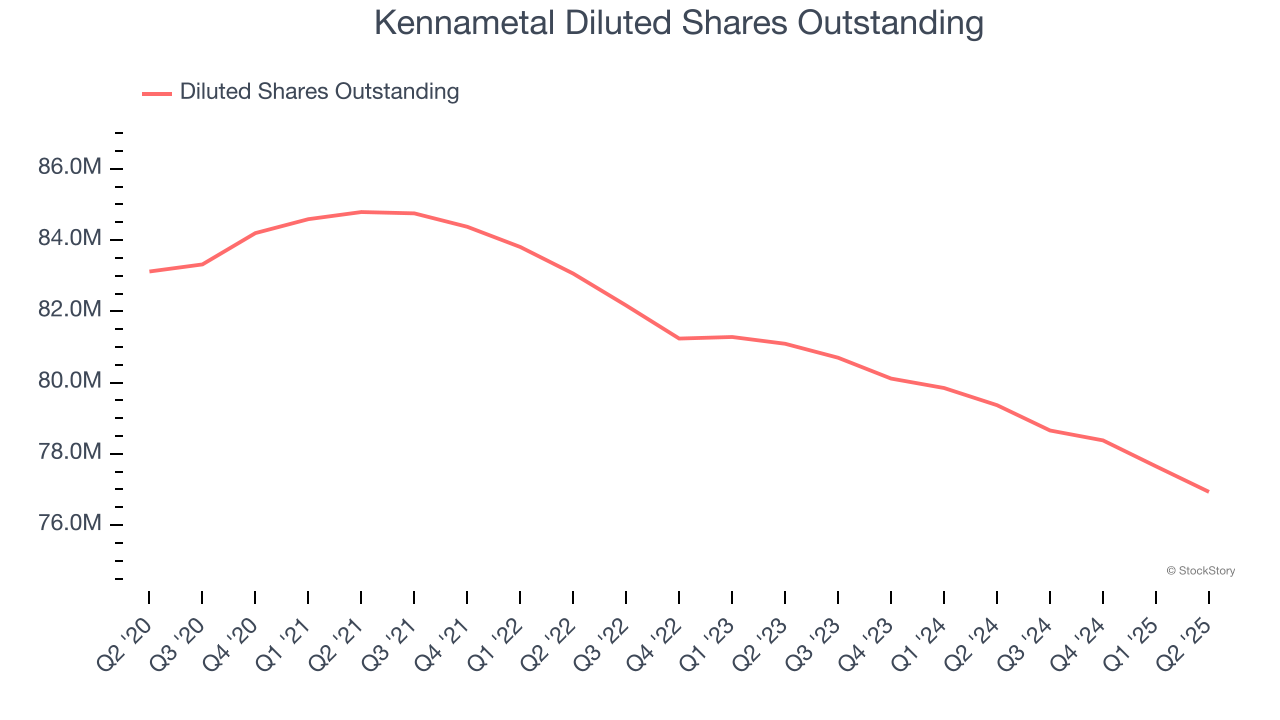
Like with revenue, we analyze EPS over a shorter period to see if we are missing a change in the business.
For Kennametal, its two-year annual EPS declines of 5.4% show it’s continued to underperform. These results were bad no matter how you slice the data.
In Q2, Kennametal reported adjusted EPS at $0.34, down from $0.49 in the same quarter last year. This print missed analysts’ estimates. Over the next 12 months, Wall Street expects Kennametal’s full-year EPS of $1.35 to grow 8.3%.
Key Takeaways from Kennametal’s Q2 Results
We struggled to find many positives in these results. Its full-year EPS guidance missed and its EPS fell short of Wall Street’s estimates. Overall, this was a weaker quarter. The stock traded down 12.4% to $22.01 immediately after reporting.
Kennametal’s earnings report left more to be desired. Let’s look forward to see if this quarter has created an opportunity to buy the stock. If you’re making that decision, you should consider the bigger picture of valuation, business qualities, as well as the latest earnings. We cover that in our actionable full research report which you can read here, it’s free.